Linear equations are straight lines. Linear = line. For the SAT, you need to understand not just how to solve linear equations but also how linear equations relate to their graphs (i.e. how to graph linear equations).
The formula for a straight line may be familiar.
y = mx+b where m is the slope and b is the y intercept
This is called slope intercept form. You should know this formula as well as you know your mother’s birthday. If you don’t know either, time to get to work memorizing!
Kickstart Your SAT Prep with Test Geek’s Free SAT Study Guide.
In order to solve graphing linear equation problems on the SAT, you need to have a strong understanding of not just what this equation is but also how to use it. Let’s dive into this.

What is the slope of a line?
Slope is how much a line rises or falls as it moves from left to right. In other words, slope is a measure of how steep a line is and if it’s going up (positive) or down (negative). Mathematically, slope can be represented as:


If we know any two points, we can calculate the slope of a line. As you get more comfortable with how expressions relate to their graphs, you’ll start to see how the slope of two lines can tell us about how the two lines are related. For the SAT, it’s important to know:
- Two lines that are parallel have the same slope.
- If line a is perpendicular to line b, line a’s slope will be the negative reciprocal of line b’s slope.
Slope Questions on the SAT
If you’re asked to find the slope of a line, typically it’ll be in one of two formats:
- Given a graph, on which you can visually identify two points.
- Given the y-intercept and another point on the line.
The first type of question is more straightforward. Let’s look at an example.
Example 1:

We can visually identify two points on this graph. Aim for points that are easy to identify and don’t require any guesswork.
I’m going to pick (0,3) and (2, -1), but you can pick any points on the line that you’d like. It’s always a good idea to label your points as P1 and P2, so you don’t accidentally plug in your numbers wrong.
P1 = (0,3)
P2 = (2,-1)
Use the formula for slope.


The slope of line t is -2. Visually check to make sure this makes sense. We can see the slope is negative (from left to right, it’s going down), so our -2 slope passes the quick visual test.
What about the other type of SAT slope questions?
In this type of question, you’re given the y-intercept and a second point (or you may even have a multi-step question that helps you find the y-intercept or the second point).
What would 200 EXTRA POINTS do for you? Boost Your SAT Score with Test Geek SAT prep.
The key here is that when you know the y-intercept of a line, you know a point on that line! Y-intercept is literally where the line crosses the y-axis. In Graph #1 above, our y-intercept is 3. You may also see this given as b = 3. We can also see that this is the point (0,3) on our line.
Let’s look at an example.
Example 2:

First, translate the y-intercept into a point.
(0,5)
Great. Now we have two points.
P1 = (0,5)
P2 = (8,10)
Use the slope formula to solve.


What is the y-Intercept of a Line?
In the slope intercept form of a line, b is the y-intercept. The y-intercept of a line is where the line crosses the y-axis. We’ve already learned how to make use of the y-intercept by translating it into a point.
The y-intercept, b, is a constant – just like the slope, m. While b and m can never change for a given line, we can infinite x and y values on that line.
How to Use y = mx + b
Now that you understand what the m and b are in the slope intercept form of a line, y=mx+b, let’s look at how to make use of this on the SAT.
y = mx + b only works if the y is by itself, and thus, has a coefficient of 1. This is really important. If your line isn’t in correct form, you’re going to get the wrong answer.
Let’s look at an example.
Example 3:

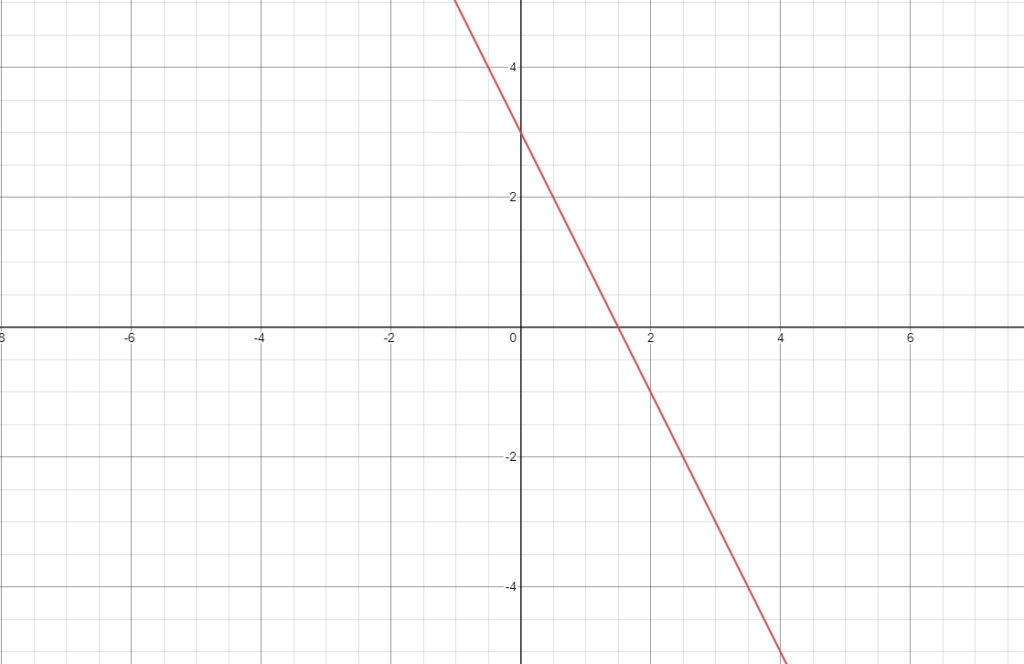
First things first. We need to get this line into the normal y=mx+b form. In order to do this, we want to isolate y.
Let’s subtract 3x from both sides.

Divide by -2.

We’re really close. It’s always a good idea to get into the exact form of y = mx + b, so you don’t make any simple mistakes. We can do this by moving things around on the right side.
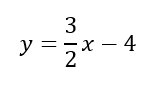
Great! Now we can see that our y intercept (b) is -4.

Quick Tips for the SAT
You’re probably starting to catch on now. SAT graphing linear equation questions are all about using the y = mx + b formula. The SAT wants to test your reasoning skills and how you navigate using this formula given various combinations of information to start with. It’s good to know that:
- If you have any two points or a single point plus b, you can solve for slope.
- If you know slope and you know b, you can solve for x if you have y.
- If you know slope and you know b, you can solve for y if you have x.
The point is: you need to identify what exactly you do have when you start a problem, so you know how to work towards what you don’t have.
Challenging SAT Graphing Linear Equation Questions
So far we’ve worked through some of what I’ll call 1 or 2-step graphing linear equation questions. These question require you to work through 1 or 2 steps to get your answer. But, sometimes you’ll see multi-step (read: challenging) questions that test your graphing linear equation skills. Ultimately, they still rely on your core understanding of how to use the y = mx + b formula, but you may need to work through several steps to get to your solution.
These more challenging questions will make use of your reasoning skills. In other words, what can you infer if you’re given some bits of related (but maybe not obviously related) information. The challenge is often where to even begin.
My advice is to write down everything you are directly given and everything you can infer based on what you’re given.
Let’s give it a try.
Example 4:

You can probably already tell this is a harder question just by reading it. There’s some variables involved. It may not be clear where to even start, but don’t fear!
Let’s begin by writing down everything we are directly given.
- Line q contains the point (4, 3).
- Line r contains the point (-1, c).
Now, let’s write down everything we can infer based on the question.
- Line q contains the point (-3, -2). We know this because the question says the lines intersect at this point, so that point must be on line q.
- Line r contains the point (-3, -2). We know this because the question says the lines intersect at this point, so that point must be on line r.
- Line q and line r are perpendicular. This tells us that the slopes of line q and line r will be inverse reciprocals.
If you aren’t sure where to go from here, one option is to try to calculate as much information as possible. Finding any slopes or y-intercepts could prove useful. We have two points on line q, so we could use them to find the slope of line q.


Because the lines are perpendicular, we know that their slopes will be inverse reciprocals. So, the slope of line r will be -7/5.
Great. This might be a good time to review our problem again and see what it’s asking for. We’re looking for the value of c. We’re given the point (-1, c) on line r. If we have the equation of line r, we could plug in x (-1) and find y (c). In order to write the equation of a line we need m and b. We know m = -7/5 for line r, but we don’t yet have b. Can we find b?
If we have m, an x and a y, we could solve for b. We have the point (-3, -2) and we know the slope is -7/5, so this should work! Let’s try plugging it all in.


Solve for b.


Now, let’s re-write the equation for line r with the m and b.

Now, we’re finally ready to find that c value! We can plug in the point (-1, c) to find c.


We have our c value.

Taking these types of questions one step at a time will reduce the overwhelm and help you get to the right answer more reliably.
Final Thoughts on SAT Graphing Linear Equations
Graphing linear inequality questions can be intimidating, but if you rely on your basic linear equation knowledge, they won’t be so bad. It’s important that you feel comfortable working in both directions: identifying a graph given an equation and identifying an equation given a graph.
If you’re short on study time, memorize y = mx + b and the quick tips I shared above. They will serve you well tackling graphing linear equation questions on the SAT.


Comments